FairVentures Data Application
FairVentures Internship Project | Waterloo, Canada
My experience working on a data visualization application as a Product Design Intern at FairVentures.

|
MY ROLE
Wireframing, UI/UX, visual design, product strategy
|
TIMELINE
4 months
Sep - Dec 2019 Internship Project |
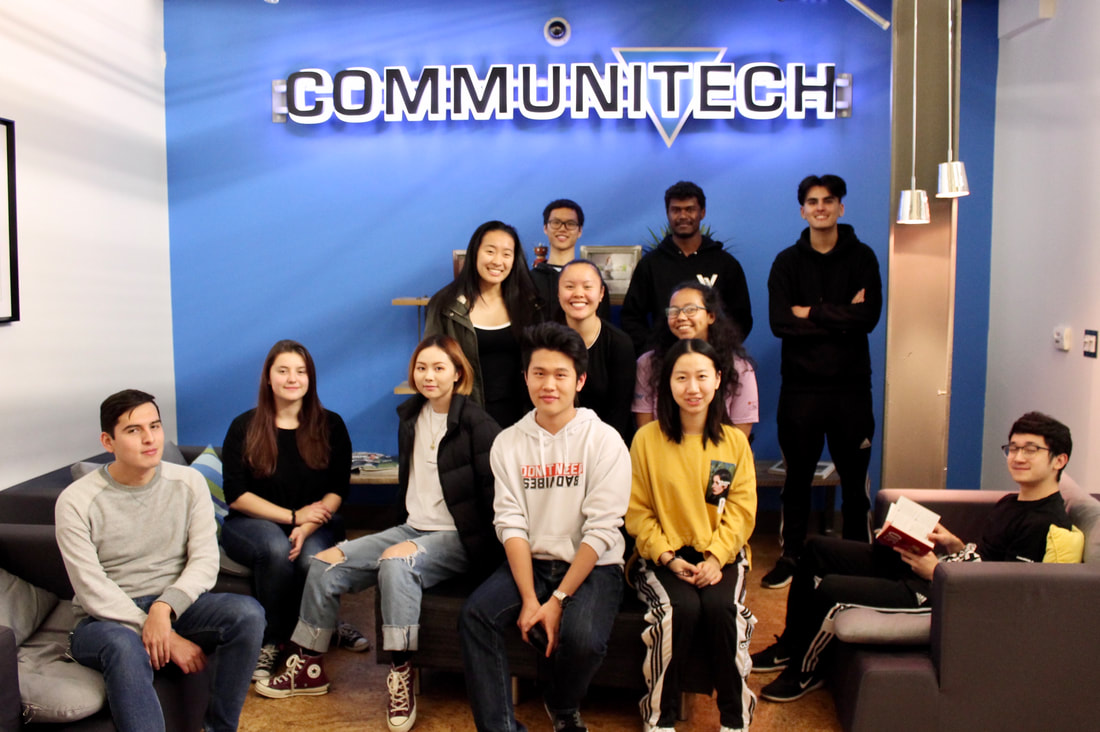
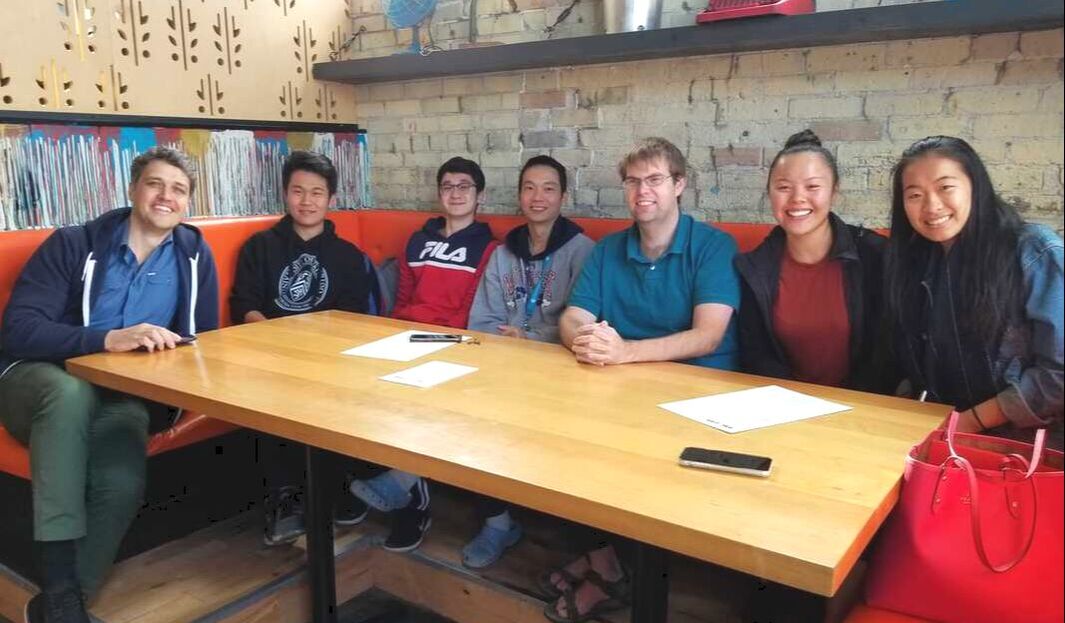
THE TEAM
|
RESULT
By leveraging the Fairfax insurance platform, my team successfully developed and launched the FairVentures Churn Analyzer Application for over 10 major insurance companies with thousands of users in 4 months. My team was able to design for insurance profitability, more specifically booking and retaining profitable customers, which was found to be a largely impactful problem for Fairfax insurance companies.
Note: For the purpose of FairVentures confidentiality, specific product details are classified or protected under NDA. Therefore, for this portfolio, I placed filler text for the designs and did not discuss all artifacts related to this project.
|
|
The Process
From research, ideation, wire-framing, designing, to prototyping, here's the end-to-end design process my team followed.

Problem Discovery
Customer retention is a large factor for insurance companies, especially when it comes to renewing or cancelling accounts. Companies depend on if a customer renews or not, if they cancel midterm, or remain active. Fairfax insurance companies are eager for data solutions in order to predict these customer decisions and increase customer retention through data applications.
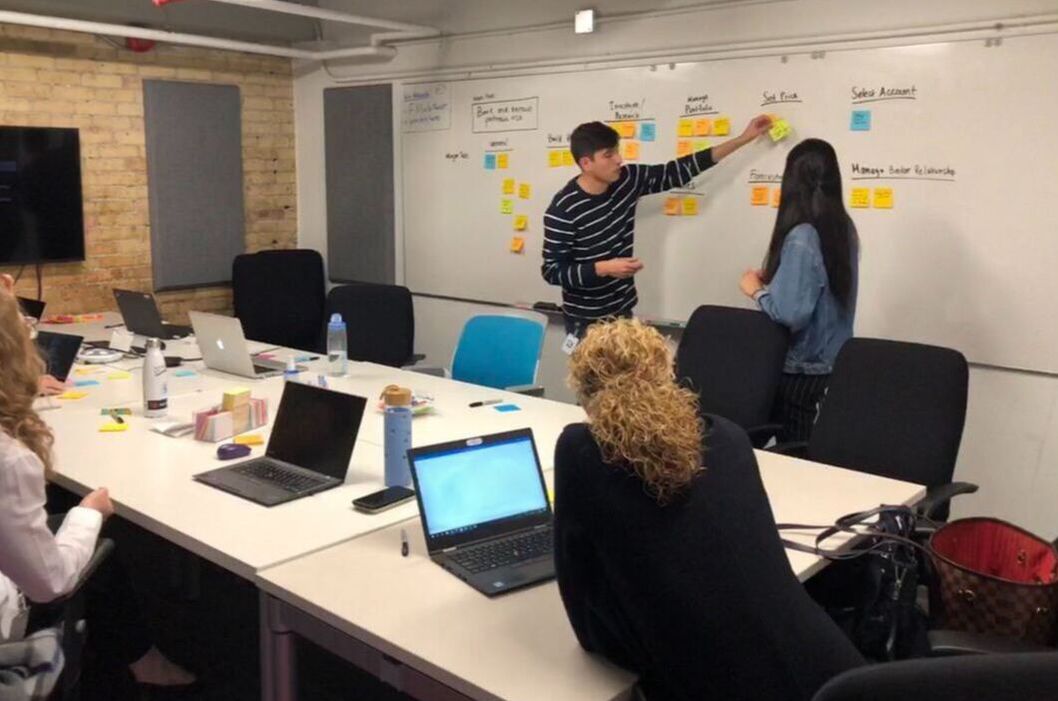
On approaching this problem, it was important to gain a better grasp of specifically how data analysts currently analyze churn rates. We conducted interviews with individuals at Fairfax insurance companies and we discovered:
On approaching this problem, it was important to gain a better grasp of specifically how data analysts currently analyze churn rates. We conducted interviews with individuals at Fairfax insurance companies and we discovered:
- What users are trying to achieve - gather information on customers, create campaigns in area
- What users actually do to achieve those goals - use current ML tools, not specific to insurance
- What experiences (personal, social, and cultural) users bring to the tasks - highly skilled professionals
- How users’ professional knowledge and experience influence the product - prior experience in data field
PROBLEM STATEMENT
The team gathered observations from user interviews in order to pinpoint the underlying themes and trends from research, and we defined the problem statement as:
" How might we use data model predictions to assist Fairfax insurance companies to make informed and profitable business decisions? "

|
PRODUCT GOALS
1. Increase Profitability - Allow companies make informed and profitable business decisions
2. Leverage Data Models - Make predictions and increase retention through data models
3. Scalable for future products - Expandable throughout Fairfax insurance companies in Canada, U.S., and the UK
2. Leverage Data Models - Make predictions and increase retention through data models
3. Scalable for future products - Expandable throughout Fairfax insurance companies in Canada, U.S., and the UK
Ideation
In order to create the initial design of the application, my team started with prioritizing the core features of the apps through a detailed feature description and behaviour-driven development approach. This required the aggregation of complex data visualizations, and the understanding of user flows and needs.
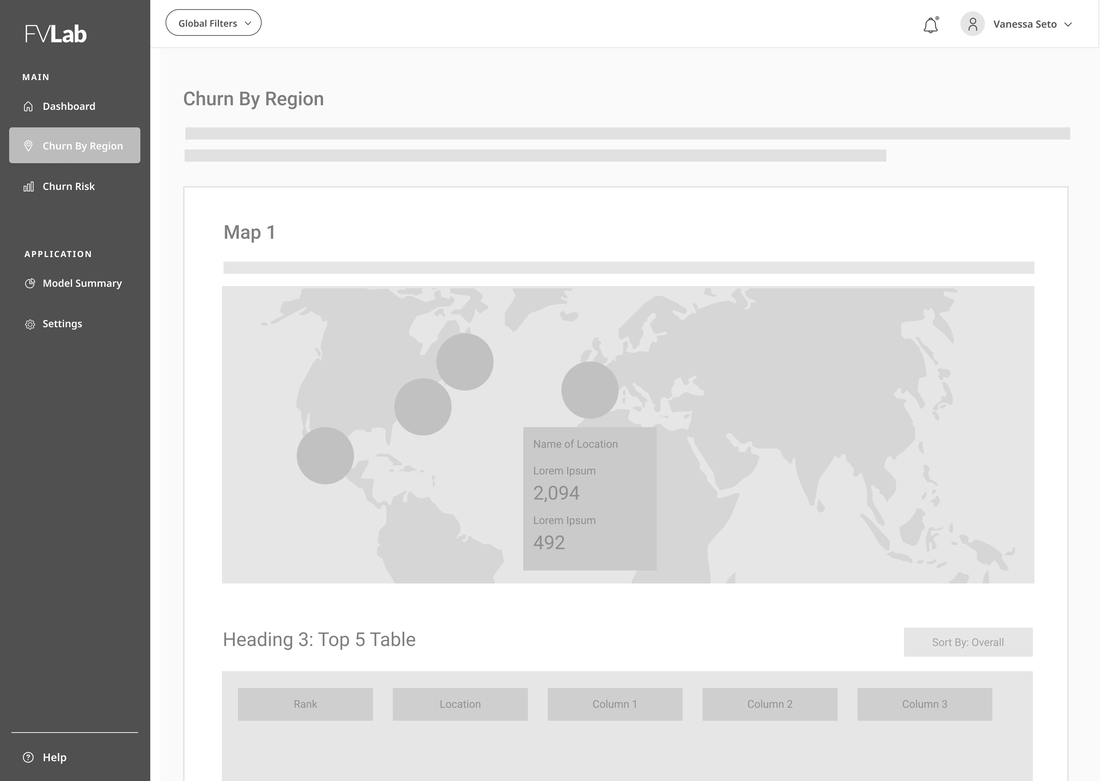
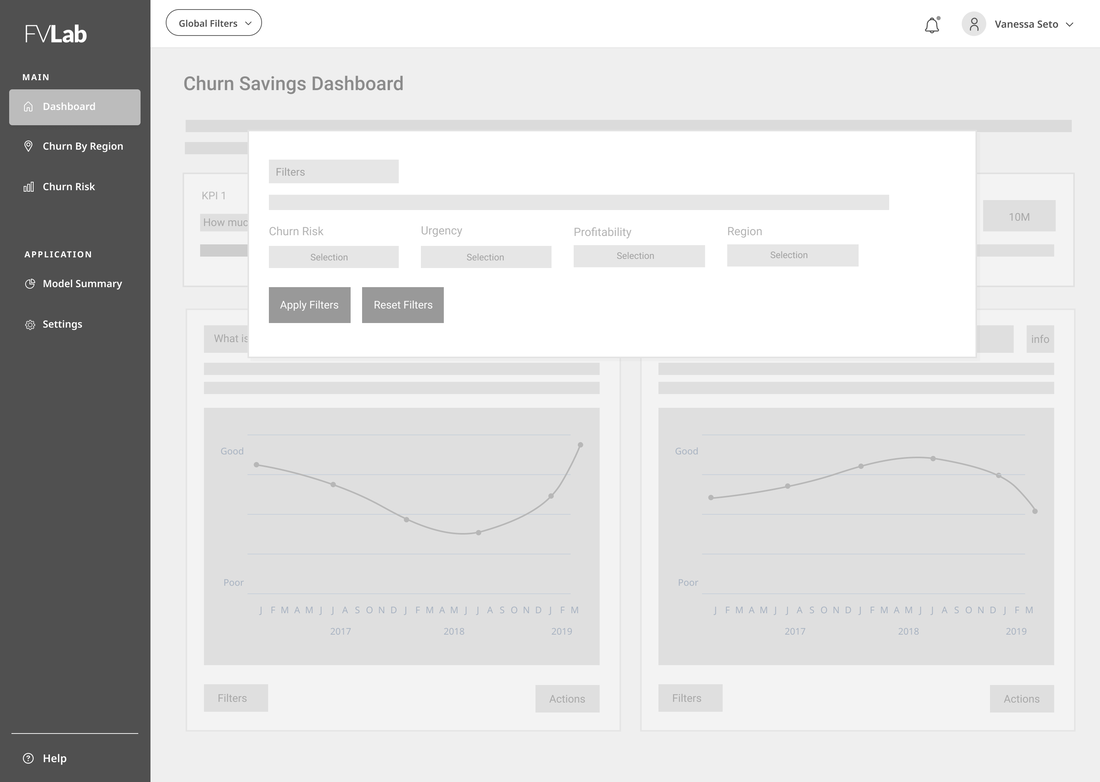
WIREFRAMING
The initial wireframes were created with the intent for scalability into a series of applications. The design of this application followed a blueprint framework in order to be expandable throughout the other Data Lab apps. I experimented on a variety of different structural frameworks and filter options to capture the overall visual approach.
|
|
|
|
STYLING
Working within the FairVentures design system, the visual design for this application drives the framework for all FairVentures Data Lab applications. The colour template reflects the neutral tones of the FairVentures branding, with the addition of cool tones to create a simplistic yet powerful feeling. For typography, we chose to stick with the simple System UI Font in order to reflect the stable and systematic feel we wanted to have consistently throughout the application.

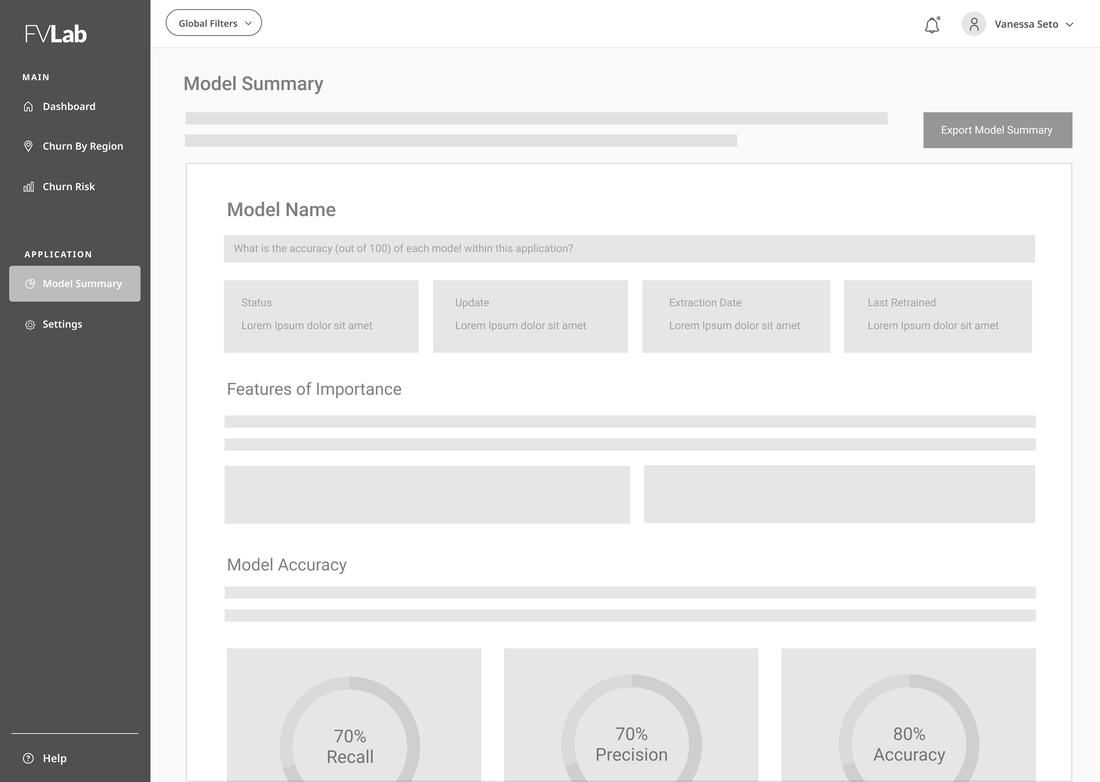
Model Summary Feature
The model summary feature is one of the most important aspects of the Churn Analyzer Application since the app is dependent on data accuracy, therefore I will zoom into this feature for this case study. Users count on the correct data model accuracies and statuses in order to make informed business decisions, therefore without this feature, all the other pages are rendered meaningless.
Purpose
1. Describe the accuracy of the two data models within the application
2. Give users (data analysts) a summary of how well the data application is performing.
2. Give users (data analysts) a summary of how well the data application is performing.
Therefore, how might we display the model accuracy in a simple and easy to understand way?
Model Summary Feature Iterations
|
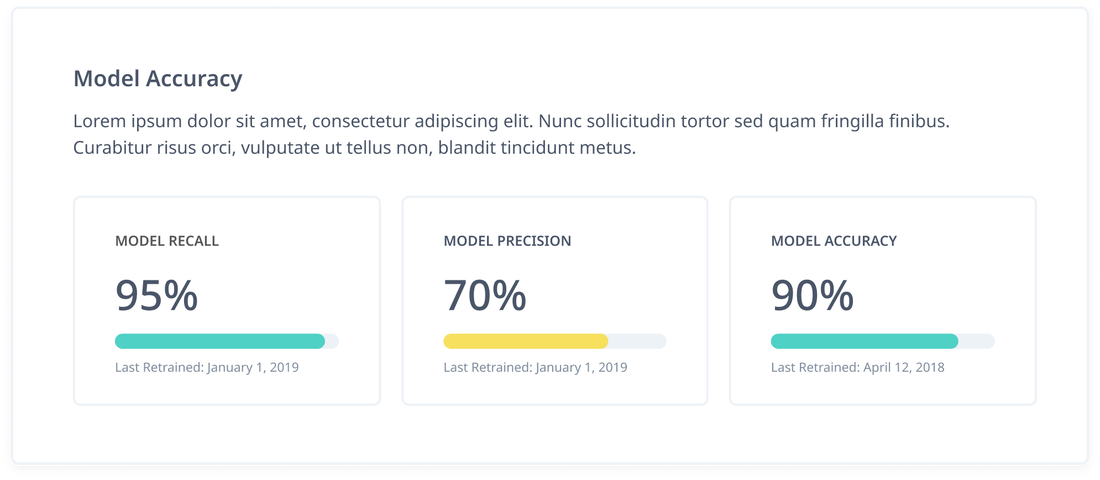
Iteration 1
Strengths: Simple bar chart with corresponding percentage for each model parameter. Visual aid with bar.
Limitations: Bar chart is often associated with progress / goals. For the purposes of displaying an accuracy, this has limitations.
|
|
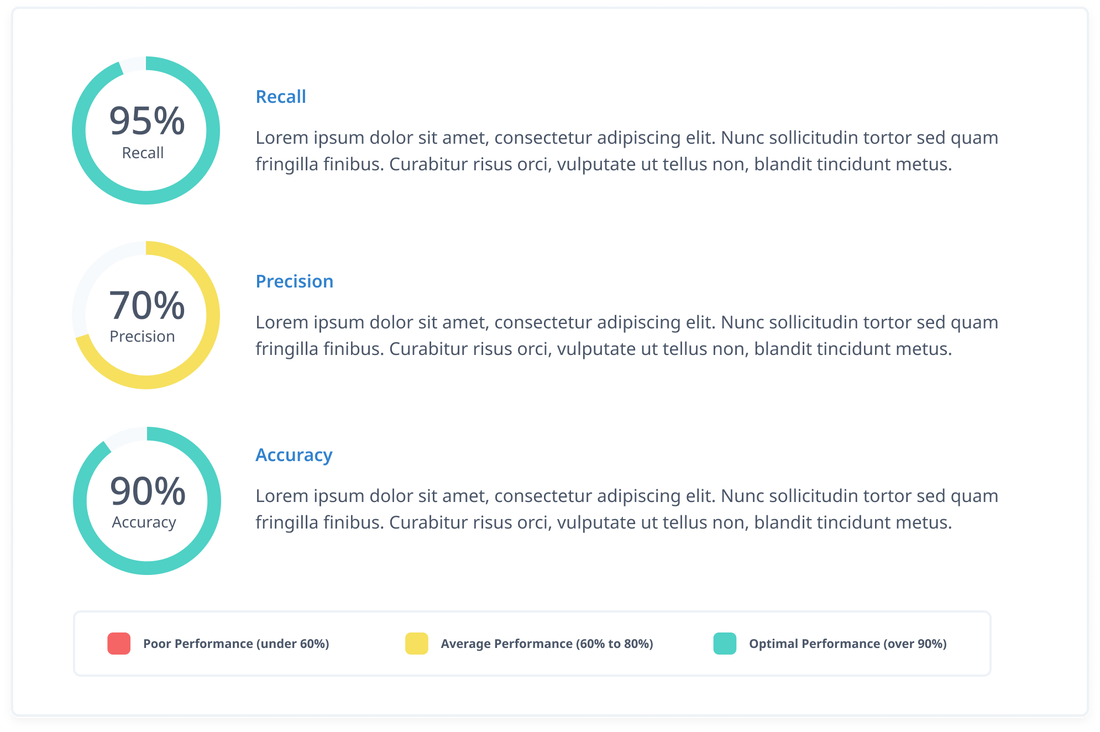
Iteration 2
Strengths: Legend to show ranges for poor, average, and optimal performance helps users easily understand accuracy.
Limitations: Having the description indented to the right disrupts the natural reading line of the page.
|
|
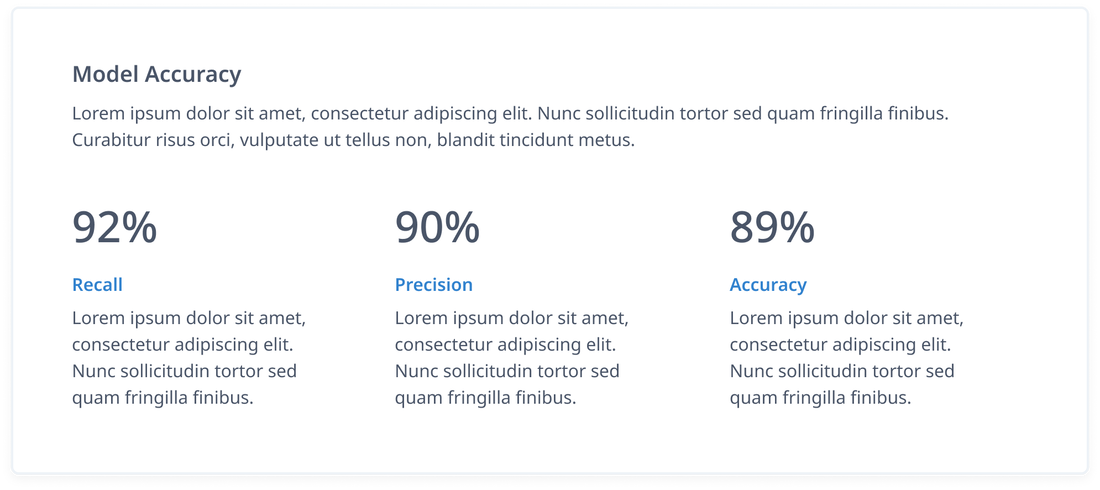
Iteration 3
Strengths: Simple percentage displayed for each parameter. Less crowded.
Limitations: No visualization to associate with accuracy, which will require more mental effort from user.
|
|
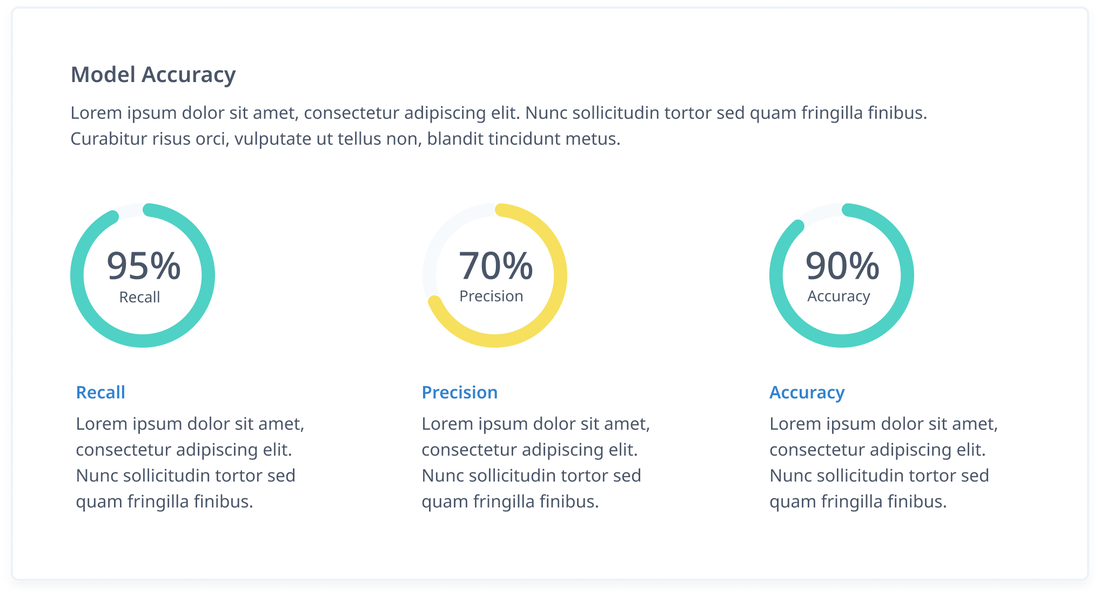
Iteration 4 and Final Iteration
Strengths: Column structure segments sections for each parameter. Circle visualization conveys the meaning of accuracy.
Limitations: No colour legend, assumption that users will understand the meaning of colours such as green (good), red(bad).
|
Let's Explore the Visual Design
The FairVentures design system guided our visual treatments to have a consistent colour palette and minimalist, trendy accents, combined with a clean, classic typeface and layout. Keeping in mind the problem statement, the main design challenge for us was to represent this data in the most user-centered way, in order to abstract all of the complex customer data into a clear design.

|
|

|
|

|
|

|
|
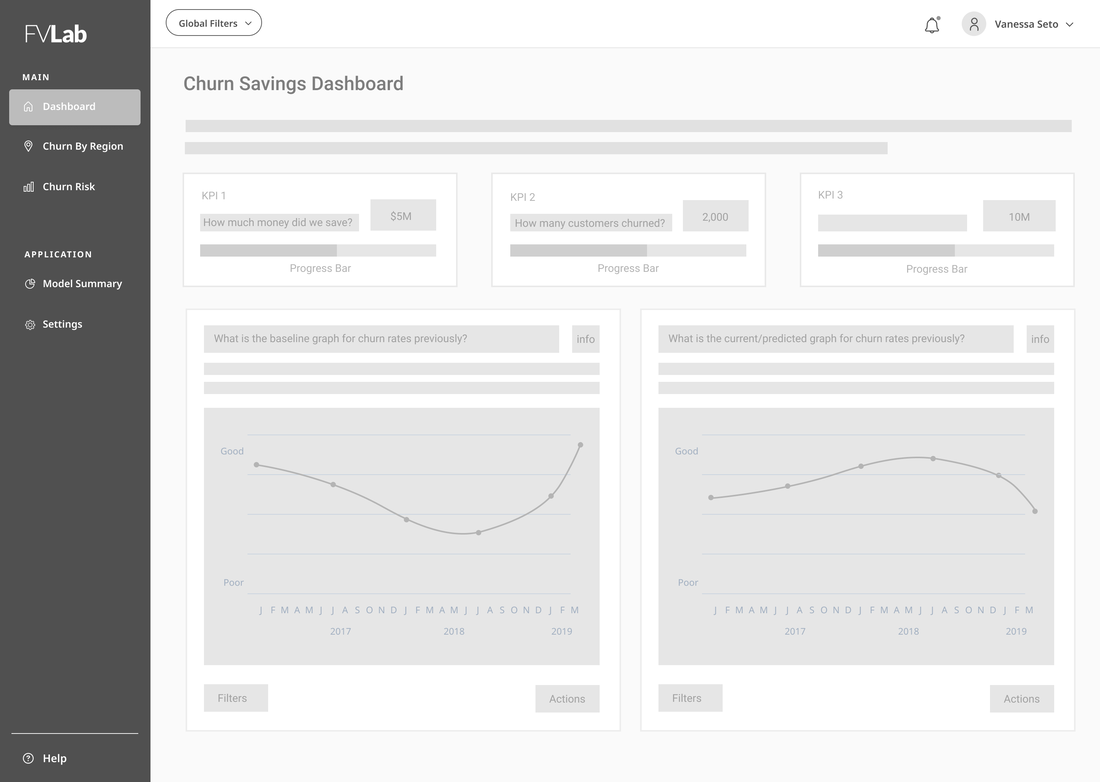
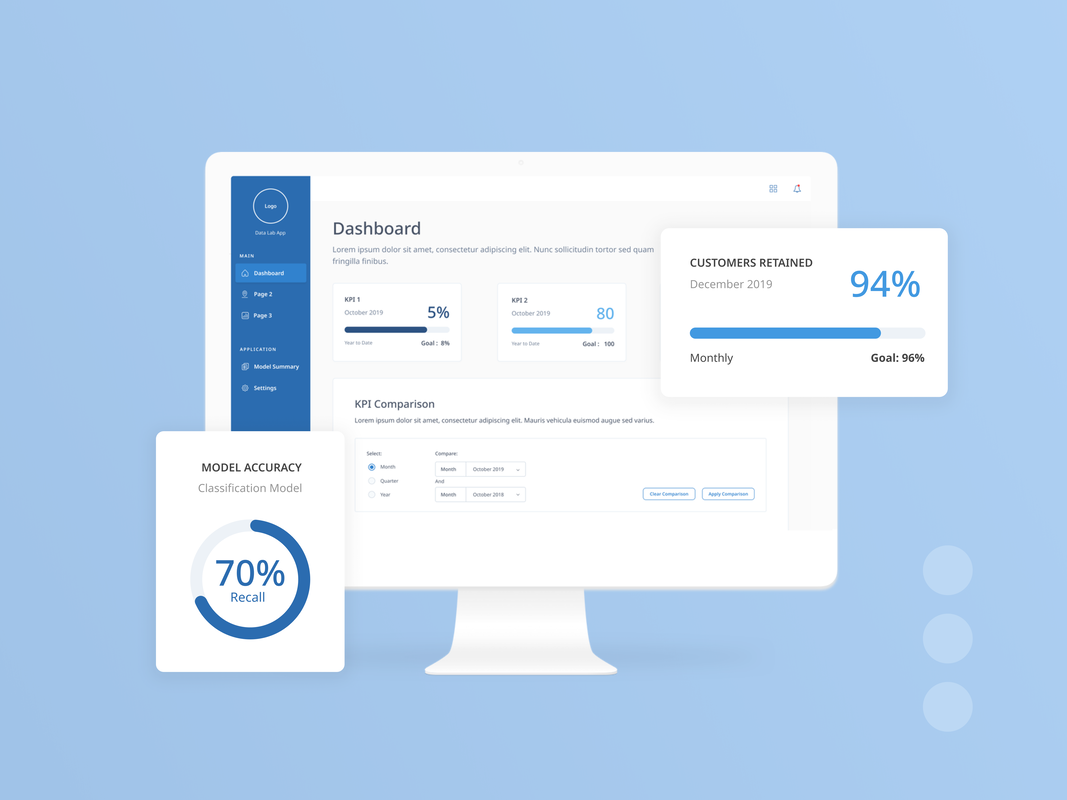
The Solution
The FairVentures Churn Analyzer App evaluates customer insurance data through data model prediction and forecasting. This outcome allows insurance companies to make informed business decisions that increase overall profitability. The apps predict customer decisions and produces recommendations for data analysts and line of business representatives to make meaningful customer decisions by evaluating customer churn behaviour.
Conclusion
This was my first project at FairVentures and it taught me the importance of collaboration with development and data teams, especially making iterations with development to assess constraints, requirements, objectives. All of my teammates worked on independent aspects of the project, while meeting up to review progress, critique and give feedback to each other. The journey and the final outcome of the project was truly a rewarding experience.
At the end of the four months, this application was developed and shipped to over 10 FairFax insurance companies, with a notable uptake in Latin American insurance companies. This suite of data applications is now an ongoing project that is still being worked on at FairVentures Lab.
At the end of the four months, this application was developed and shipped to over 10 FairFax insurance companies, with a notable uptake in Latin American insurance companies. This suite of data applications is now an ongoing project that is still being worked on at FairVentures Lab.
|
|